


주메뉴
- About IBS 연구원소개
-
Research Centers
연구단소개
- Research Outcomes
- Mathematics
- Physics
- Center for Underground Physics
- Center for Theoretical Physics of the Universe (Particle Theory and Cosmology Group)
- Center for Theoretical Physics of the Universe (Cosmology, Gravity and Astroparticle Physics Group)
- Dark Matter Axion Group
- Center for Artificial Low Dimensional Electronic Systems
- Center for Quantum Nanoscience
- Center for Exotic Nuclear Studies
- Center for Van der Waals Quantum Solids
- Center for Relativistic Laser Science
- Center for Trapped Ion Quantum Science
- Chemistry
- Life Sciences
- Center for Memory and Glioscience (Cognitive Glioscience Group)
- Center for Memory and Glioscience (Learning and Memory Group)
- Center for Synaptic Brain Dysfunctions
- Center for RNA Research
- Center for Genomic Integrity
- Center for Vascular Research
- Center for Genome Engineering
- Center for Microbiome–Body–Brain Physiology
- Earth Science
- Interdisciplinary
- Center for Neuroscience Imaging Research (Neuro Technology Group)
- Center for Neuroscience Imaging Research (Cognitive and Computational Neuroscience Group)
- Center for Algorithmic and Robotized Synthesis
- Center for Nanomedicine
- Center for Biomolecular and Cellular Structure
- Center for 2D Quantum Heterostructures
- Institutes
- Korea Virus Research Institute
- News Center 뉴스 센터
- Career 인재초빙
- Living in Korea IBS School-UST
- IBS School 윤리경영

주메뉴
- About IBS
-
Research Centers
- Research Outcomes
- Mathematics
- Physics
- Center for Underground Physics
- Center for Theoretical Physics of the Universe (Particle Theory and Cosmology Group)
- Center for Theoretical Physics of the Universe (Cosmology, Gravity and Astroparticle Physics Group)
- Dark Matter Axion Group
- Center for Artificial Low Dimensional Electronic Systems
- Center for Quantum Nanoscience
- Center for Exotic Nuclear Studies
- Center for Van der Waals Quantum Solids
- Center for Relativistic Laser Science
- Center for Trapped Ion Quantum Science
- Chemistry
- Life Sciences
- Center for Memory and Glioscience (Cognitive Glioscience Group)
- Center for Memory and Glioscience (Learning and Memory Group)
- Center for Synaptic Brain Dysfunctions
- Center for RNA Research
- Center for Genomic Integrity
- Center for Vascular Research
- Center for Genome Engineering
- Center for Microbiome–Body–Brain Physiology
- Earth Science
- Interdisciplinary
- Center for Neuroscience Imaging Research (Neuro Technology Group)
- Center for Neuroscience Imaging Research (Cognitive and Computational Neuroscience Group)
- Center for Algorithmic and Robotized Synthesis
- Center for Nanomedicine
- Center for Biomolecular and Cellular Structure
- Center for 2D Quantum Heterostructures
- Institutes
- Korea Virus Research Institute
- News Center
- Career
- Living in Korea
- IBS School


News Center

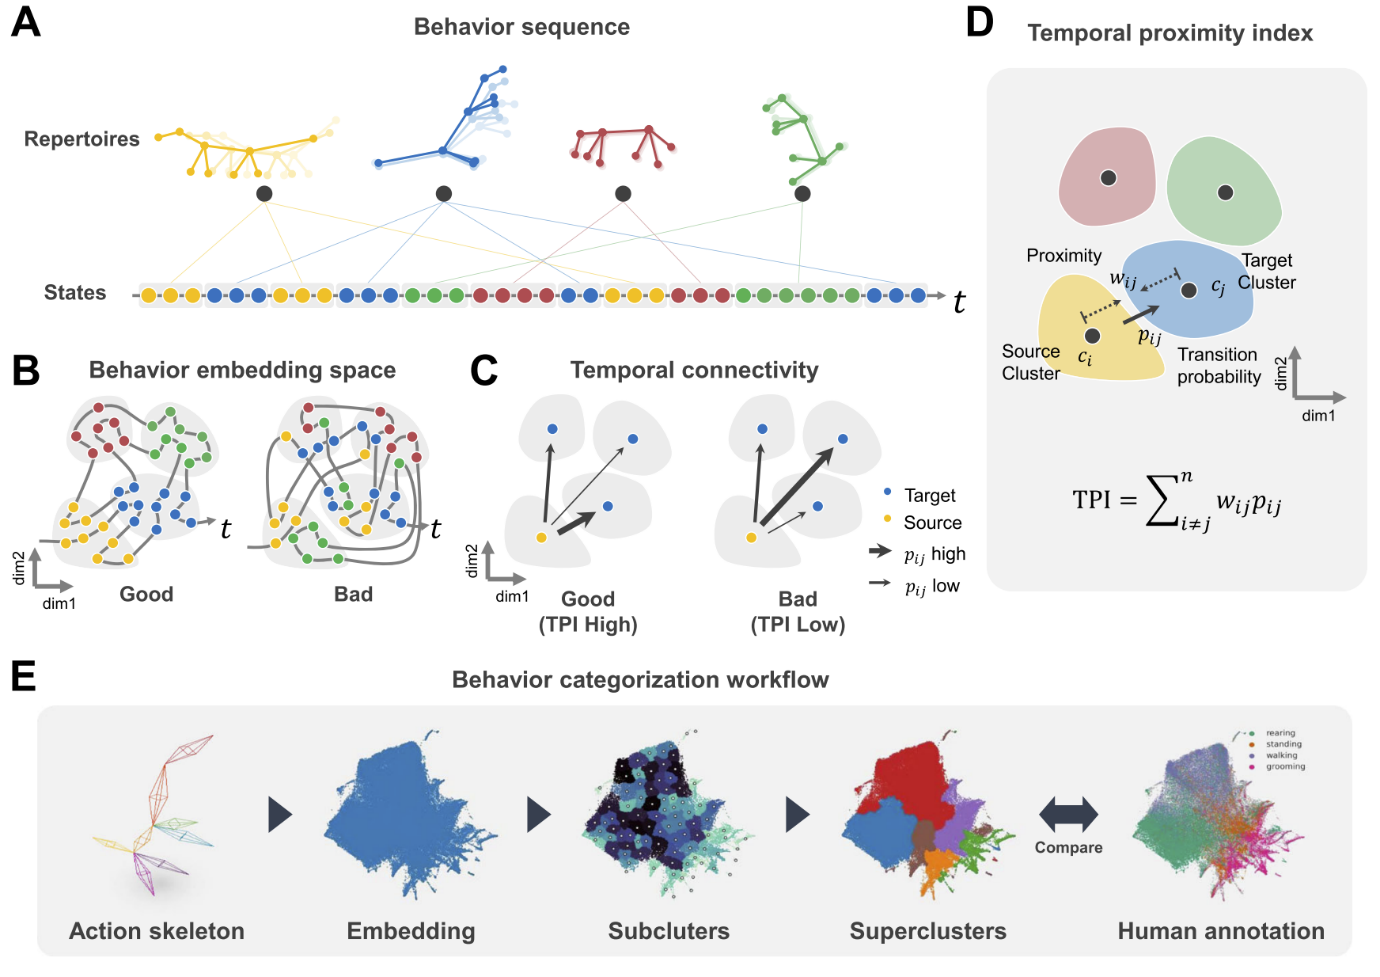
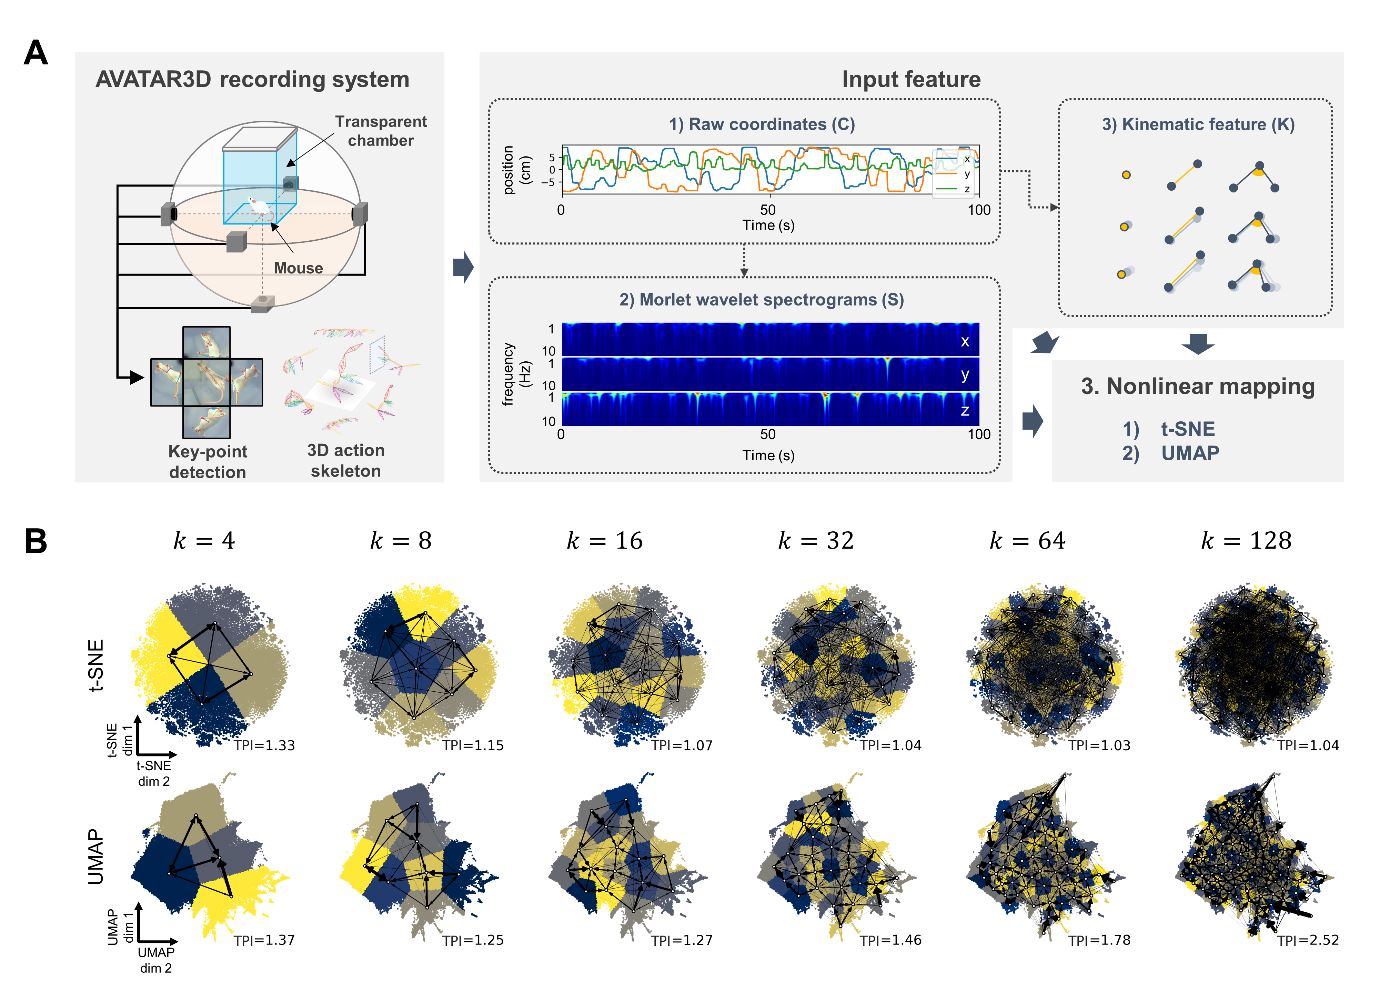
New AI Tool Developed for Advanced Animal Behavior Analysis- The animal analysis model has vast applications, from biological research to robotics - Animal behavior analysis is a fundamental tool in various studies, ranging from basic neuroscience research to understanding the causes and treatments of diseases. It is widely applied not only in biological research but also across various industrial fields, including robotics. Recently, efforts have been made to accurately analyze animal behaviors using AI technology. However, there are still limitations for AI to intuitively recognize different behaviors like human observers can. Traditional animal behavior research primarily involved filming animals with a single camera and analyzing low-dimensional data such as the time and frequency of specific movements. The analysis method provided AI with corresponding results for each piece of training data, akin to simply feeding AI with questions along with the answer key. While this method is straightforward, it requires time and labor-intensive human supervision to build the data. Observer bias is also a factor, as the analysis results can be distorted by the experimenter's subjective judgment. To overcome those limitations, a joint research team led by Director C. Justin LEE of the Center for Cognition and Sociality within the Institute for Basic Science, and CHA Meeyoung, the Chief Investigator (CI) of the Data Science Group at the IBS Center for Mathematical and Computational Sciences (also a professor in the School of Computing at KAIST), has developed a new analytical tool called 'SUBTLE' (Spectrogram-UMAP-Based Temporal-Link Embedding). SUBTLE classifies and analyzes animal behavior through AI learning based on 3D movement information. First, the research team recorded the movements of mice using multiple cameras, extracting the coordinates of nine key points such as the head, legs, and hips to obtain 3D action skeleton movement data over time. They then reduced this time-series data into two dimensions for embedding, a process that creates a collection of vectors corresponding to each piece of data, allowing complex data to be represented more concisely and meaningfully. Next, the researchers clustered similar behavior states into subclusters and grouped these subclusters into superclusters representing standardized behavior patterns (repertoires), such as walking, standing, grooming, etc. During this process, they proposed a new metric called the Temporal Proximity Index (TPI) to evaluate behavior data clusters. This metric measures whether each cluster includes the same behavior state and effectively represents temporal movements, similar to how humans consider temporal information important when classifying behavior. CI CHA Meeyoung stated, "The introduction of new evaluation metrics and benchmark data to aid in the automation of animal behavior classification is a result of the collaboration between neuroscience and data science. We expect this algorithm to be beneficial in various industries requiring behavior pattern recognition, including the robotics industry, which aims to mimic animal movements." Director C. Justin LEE of the Center for Cognition and Sociality, who led this research commented, "We have developed an effective behavior analysis framework that minimizes human intervention while understanding complex animal behaviors by applying human behavior pattern recognition mechanisms. This framework has significant industrial applications and can also be used as a tool to gain deeper insights into the principles of behavior recognition in the brain." Additionally, the research team transferred SUBTLE technology to Actnova, a company specializing in AI-based clinical and non-clinical behavior test analysis, in April last year. The team utilized Actnova's animal behavior analysis system, AVATAR3D, to obtain 3D movement data of animals for this research. The research team has also made SUBTLE's code open-source, and a user-friendly graphical interface (GUI) to facilitate animal behavior analysis is available through the SUBTLE web service (http://subtle.ibs.re.kr/) for researchers who are not familiar with programming. This research was published online on May 20th in the prestigious AI computer vision journal, the International Journal of Computer Vision (IJCV).
Notes for editors
- References
- Media Contact
- About the Institute for Basic Science (IBS)
|
| Next | |
|---|---|
| before |
- Content Manager
- Public Relations Team : Suh, William Insang 042-878-8137
- Last Update 2023-11-28 14:20
55, Expo-ro, Yuseong-gu, Daejeon, Korea, 34126
Tel. +82-42-878-8114 | Fax. +82-42-878-8079 | E-mail. webmaster@ibs.re.kr
Copyright(c) IBS. All Rights Reserved.
